9 Real Valued Functions
This chapter builds upon the definitions of functions studied in Chapter 5, using the algebra material from Chapters 7 and 8, to study the interplay between the verbal, algebraic, tabular, and graphical representations of functions.
Related Content Standards
- (8.F.2) Compare properties of two functions each represented in a different way (algebraically, graphically, numerically in tables, or by verbal descriptions).
- (HSF.IF.9) Compare properties of two functions each represented in a different way (algebraically, graphically, numerically in tables, or by verbal descriptions).
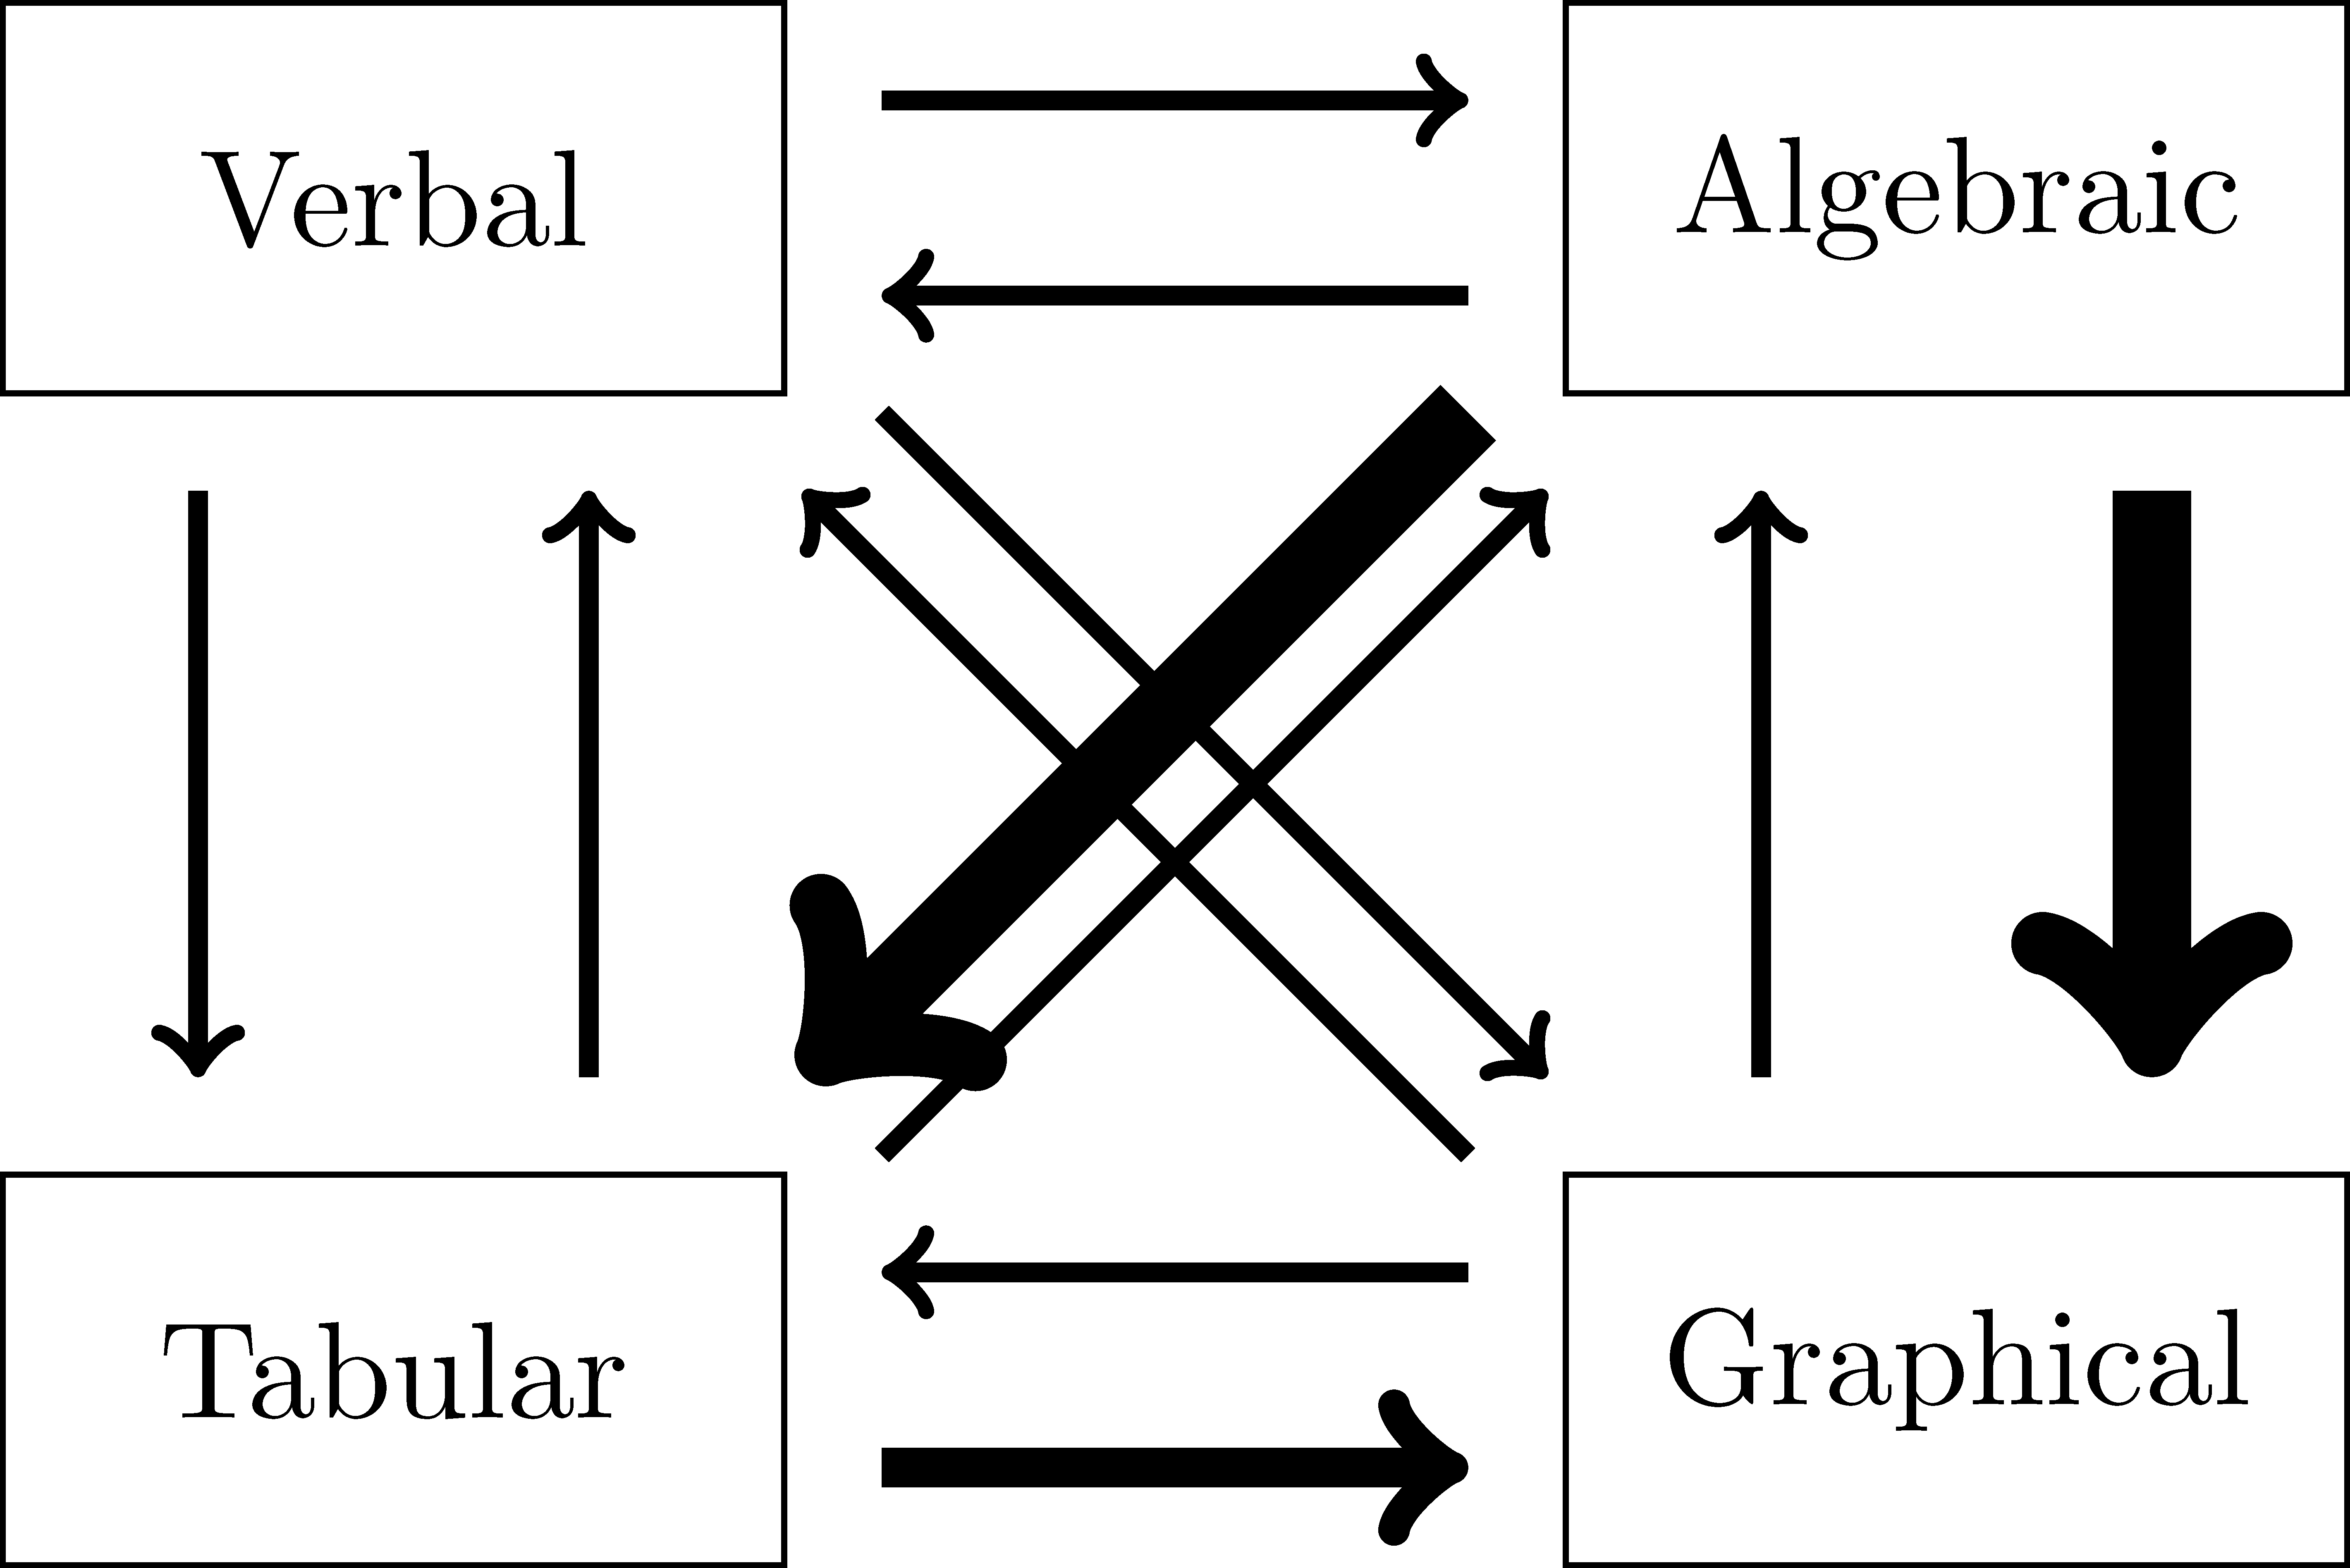
Figure 9.1: Emphases of translations between function representations
This process of translating between the different representations of a function is a key aspect of problem solving because different problems are more easily solved using different representations. For instance, if a set of data is given in a tabular format one would often use regression techniques to generate a graphical and algebraic representations of a function that models that data in order to interpolate or extrapolate information about the data within the context of the verbal situation given. Each of these different representations work together to help generate and interpret possible solutions to the problems determined. As such, it is important for students to be able to move from one representation to another. And so as teachers, we need to keep this in mind and we choose various representations of the functions in the teaching process.
In the secondary curriculum, students frequently move from algebraic expressions to graphical representations, either by hand or using technology, as stated in the Common Core Standard HSF.IF.7. However, students rarely translate from a graphical representation to an algebraic representation. We represent the different emphases between the translations by different sized arrows in Figure 9.1.
Related Content Standards
- (HSF.IF.7) Graph functions expressed symbolically and show key features of the graph, by hand in simple cases and using technology for more complicated cases.
- Graph linear and quadratic functions and show intercepts, maxima, and minima.
- Graph square root, cube root, and piecewise-defined functions, including step functions and absolute value functions.
- Graph polynomial functions, identifying zeros when suitable factorizations are available, and showing end behavior.
- Graph rational functions, identifying zeros and asymptotes when suitable factorizations are available, and showing end behavior.
- Graph exponential and logarithmic functions, showing intercepts and end behavior, and trigonometric functions, showing period, midline, and amplitude.