14.2 Teaching and Learning of Data Analysis and Statistics
Even though the disciplines of statistics and data analysis are very distinct from mathematics in many ways, the teaching and learning of the methods of statistics and the processes of data analysis are often incorporated into the curriculum of mathematics. This incorporation of data analysis and statistics into the field of mathematics education derives from two major factors.
The first is that most disciplines see data analysis as a tool in their discipline, but not one of the central tenants of the discipline. For instance, science uses statistics to account for the reliability of their measurements with probabilistic reasoning taking a more prominent role with concepts such as the make-up of an atom. Similarly, history uses data analysis to understand population changes and make arguments about when and how certain activities like changes in societal structures most likely occurred. However, neither of these disciplines considers data analysis and statistics as a core part of their work.
Organizations such as the National Council of Teachers of Mathematics (NCTM) in documents such as Curriculum and Evaluation Standards for School Mathematics (NCTM, 1989) list ‘Data Analysis and Probability’ as one of the five content strands, thereby actively adopting these disciplines as part of the mathematical sciences.
![Data Analysis Investigative Process [@GAISE2]](tikz/GAISE3.png)
Figure 14.1: Data Analysis Investigative Process (Bargagliotti et al., 2020)
In an effort to help teachers of mathematics better understand the discipline of statistics in order that they could teach the subject better, the American Statistical Association published the Guidelines for Assessment and Instruction in Statistics Education (GAISE) Report (Franklin et al., 2007) and a follow-up report, Pre-K–12 Guidelines for Assessment and Instruction in Statistics Education II (GAISE II) (Bargagliotti et al., 2020). These documents outline a conceptual framework for statistics education and describes the data analysis process having four major components (formulate questions, collect data, analyze data, and interpret results) that we will discuss in detail below.
While many people think of these four components of the data analysis process as linear, most of the time the process is iterative, jumping between the four components as the work progresses (see Figure 14.1). For instance, a person might produce a graph or chart that causes a question to arise in his or her mind. This question could cause him or her to analyze the data in a different way, modify the interpretation of the results of the current analysis, or seek to collect additional data. Alternatively, a person might notice a pattern when collecting data for some purpose that causes them to make an interpretation, formulate new questions based on the data collected, or change their planned data analysis.
Another important aspect of the data analysis process is the centrality of variability. It is important to remember that “statistical problem solving and decision making depend on understanding, explaining, and quantifying the variability in the data” (Franklin et al., 2007, p. 6). So the concept of variability needs to be at the forefront of the teacher and students’ minds as they work through and learn within the data analysis process.
In order to acknowledge that students have different levels of understanding and skills in the data analysis process, within each of these processes and the underlying focus on variability the GAISE framework considers three different levels (Level A, Level B, and Level C). A teacher needs to be able to recognize where students may be within this framework and support students’ progression to higher levels of understanding. Critically, the GAISE framework at no point discusses different types of statistical techniques. This allows this same framework to be used in the teaching and learning of data analysis for sixth graders learning how to use box-and-whisker plots or high school seniors learning how to use a \(\chi^2\) test for categorical data.
In order to understand this data analysis investigative process and the centrality of variability within the process we will give a more detailed explanation of each of the components, along with examples highlighting the different levels within that process component. For a more detailed description, see the full GAISE Reports (Bargagliotti et al., 2020; Franklin et al., 2007).
Related Content Standards
- (6.SPA.1) Recognize a statistical question as one that anticipates variability in the data related to the question and accounts for it in the answers.
Formulate Questions.
A key component of formulating questions in the data analysis process is having questions that anticipate variability.
- Level A. A student or class is at the first level of the framework if the teacher is the one posing the questions of interest or is having to reword students’ questions from those with a deterministic or definite answer, such as “How many desks are in this classroom?”, to become questions that allow for, and expect, variability, such as “How many students are in most classrooms in our school district?”.
- Level B. The second level corresponds with the ability to formulate questions that account for sampling variability within a group or between groups. The questions also begin to recognize the distinction between a population and a sample. Some sample questions would be, “Are students in our class generally taller than students in the other classes in the school?” or “Are 14 year old boys usually shorter than 14 year old girls?”.
- Level C. Students at Level C pose questions that also account for chance variability and think of the world in a more probabilistic sense. These questions often include questions about the strength of relationships and/or the reliability of the measurements creating the data.
Collect Data.
The design of the data collection component of the investigative process should acknowledge that variability exists, take steps to reduce the amount of variability due to factors that are not the main purpose of the investigation (such as measurement errors), and use techniques such as random sampling in order to reduce the differences between the sample and the population. A key component of this data collection design process involves the affect of the sample size upon the reliability of the results.
- Level A. These individuals do not account for sample size (it might be mentioned, but no connections are made with the other components of the process), ignores possible measurement errors, and does not use random selection.
- Level B. This level involves accounting for some of the aspects of controlling variability in the data collection process mentioned above, but does not account for all of them.
- Level C. Individuals at this level explicitly account for sample size, measurement error, and uses random sampling techniques when using samples to predict properties of a larger population.
Analyze Data.
The purpose of the analysis component in the investigative process is to give an accounting for the variability in the situation.
- Level A. These students are able to create graphical displays, compute parameters, or perform statistical tests on data, but are unable to explain why a certain analysis technique is used. Such a student may find the mean and standard deviation of a set of data, but does not explain why those parameters address the situation better than a median and interquartile range.
- Level B. A Level B understanding corresponds with the quantification of the variability, but uses a single technique or does not consider the underlying distribution in the justification of the techniques used.
- Level C. A Level C student focuses on using multiple techniques to build an argument based in the context of the data. The analyses also recognize the underlying probability distributions involved in the situation as part of the justification of the statistical techniques used.
Interpret Results.
Interpretation must be intertwined with an understanding of the context of the data and attempt to explain the sources of the variability in the situation. Quality interpretations must take into account the sample size; effects of random selection; measures of strength of association and models; distinguish between causation and correlation; and the difference between different types of studies.
- Level A. A Level A interpretation gives some results and states a conclusion without discussing the other aspects of the situation. These students focus on the data and struggle to generalize to the larger context.
- Level B. These interpretations move beyond basic summaries, but do not account for all of the variability and nuance of the context.
- Level C. A Level C interpretation discusses how the different techniques are used and the results from the analysis work together to justify the conclusions. They also keep in central the context of the situation and the variability involved. }
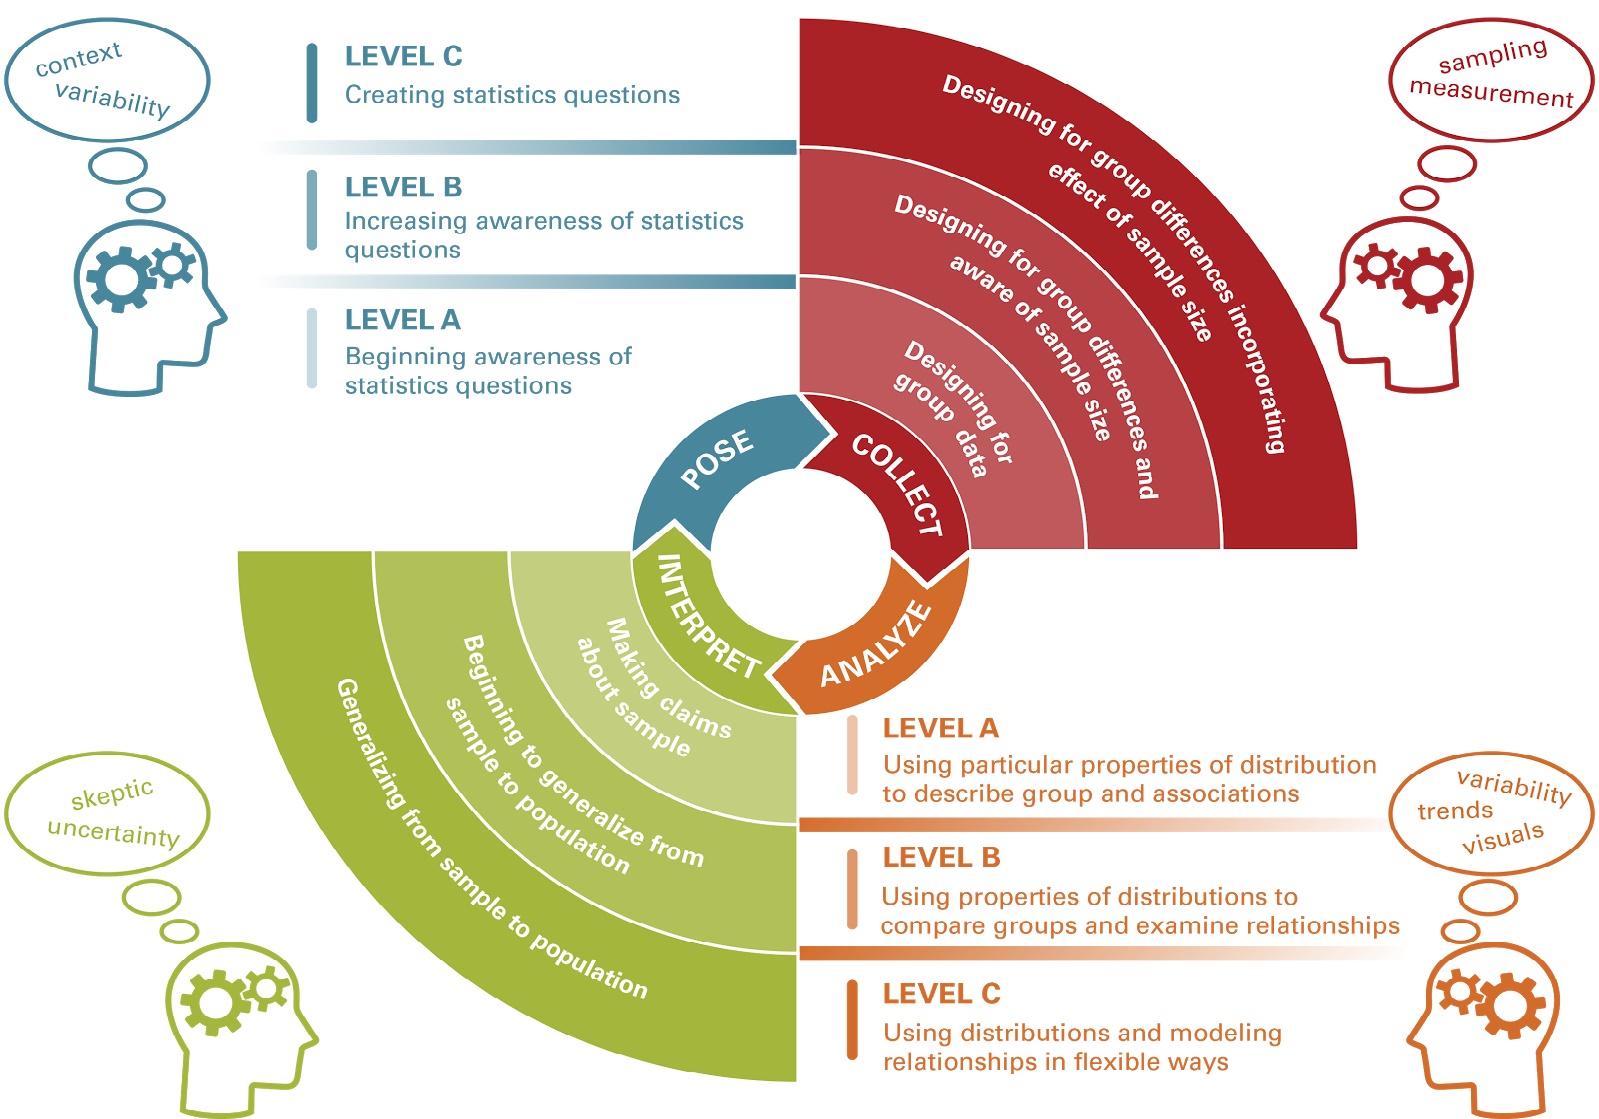
Figure 14.2: Students’ Approaches to Statistical Investigations (SASI) Framework Lee & Tran (2015)
14.2.1 Statistical Habits of Mind
As students engage in the data analysis investigative process, one of the primary goals for students is to develop a new way of thinking about the world and the use of data in our world. Chance (2002) listed six mental habits for students to develop as they learn to think statistically.
These mental habits include:
- consideration of how to best obtain meaningful and relevant data to answer the question at hand
- constant reflection on the variables involved and curiosity for other ways of examining and thinking about the data and problem at hand
- seeing the complete process with constant revision of each component
- omnipresent skepticism about the data obtained
- constant relation of the data to the context of the problem and interpretation of the conclusions in non-statistical terms
- thinking beyond the textbook
The chapters on data analysis in this text are designed to help develop these habits of mind through examples and engagement in various projects involving the investigative process. Remember that in the teaching and learning of probability, data analysis, and statistics the main goal is not to learn how to perform statistical calculations, but to develop these habits of mind and improve one’s ability to produce and understand arguments based upon the analysis of data. Overall, this will help us be active participating members of society that can think for ourselves.
14.2.2 Exercises
Write a short essay on why data analysis should be taught in K-12 schools.
Determine where each of the following questions fall in the framework. Then modify the question to be at a Level C.
- How many people are in this classroom?
- What type of food do students in our school prefer?
- What types of memes spread fastest?
Determine where each of the following scenarios for the collection of data would fall in the framework. Then modify the scenario to be at a Level C.
- In an effort to determine if plants grow better in red light or blue light, a student has one plant that grows under a red light bulb for 4 weeks and one plant that grows under a blue light bulb for 4 weeks. The student then measures the difference in the heights of the plants.
- The students in a class measure their height and arm span in order to determine if there is a relationship between the two measurements for people.
- Using the nutrition information for McDonald’s, students look for how many calories are in a gram of fat.
Determine where each of the following scenarios for the analysis of data would fall in the framework. Then modify the scenario to be at a Level C.
- In order to determine how much it will cost to go to college, students find the mean tuition rates of all of the colleges in their state.
- In order to predict who will win a presidential election, a poll asks a random sample of likely voters across the country who they will vote for. This data is analyzed, giving a percentage of votes for each person with a margin of error.
Determine where each of the following scenarios for the interpretation component of the investigative process would fall in the framework. Then modify the scenario to be at a Level C.
- From 2017-2019 the information about fatal police shootings4 indicated that 1,226 white people, 667 black people, and 485 Hispanic people were fatally shot by police. A person concludes that a white person is more likely to be fatally shot by police than a black person.
Find a news article or research article of interest to you that involves a data analysis process and analyze the article within the context of the GAISE Framework to describe the probable level within each of the four processes represented by the article.
References
https://www.statista.com/statistics/585152/people-shot-to-death-by-us-police-by-race/ retrieved August 1, 2020↩︎